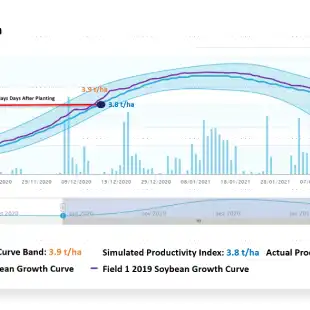
With 6th Grain’s Optimal Growth Curve, users monitor the progress of crop development as the crop canopy develops and can compare field progress to the Optimal Growth Curve of the best fields in the region.
Larger commercial growers, crop input providers, and other clients with a large number of fields face a mission-critical problem: their users do not want to, or cannot, input field data.
6th Grain created Optimal Growth Curve to solve this user problem. Thanks to our integration of Deep Learning into the Curve, users have access to the same great tools provided by our FieldFocus crop health and productivity solution, with the game-changing benefit of requiring minimal user input.
Optimal Growth Curve Benefits
- Minimal user input allows users to simply click on the field of interest without having to provide field-specific information
- In-season crop monitoring aids users in identifying which fields are performing poorly and helps them respond before productivity loss occurs
- Field overlay and Optimal Growth Curve Band allows users to compare current field performance with previous year and other similar regional fields
- Estimation of field production during the growing season
Optimal Growth Curve Modules
- Optimal Growth Curve Band
Estimates in-season variation of both cropped area and production. - High Resolution Satellite Remote Sensing
Monitors field biomass and canopy closure. - Ground Data Observations
Increases and reinforces validity and accuracy of Optimal Growth Curve. - Field-Specific Monitoring
Updates every 3-5 days throughout the season, thanks to spatially explicit time series analysis. - Best Field Comparison
Compares user field with best performing fields in the field region. - Time Series Field Comparison
6G Index time series lets users compare their field Optimal Growth Curve with the current year and last year’s time series - Weather Intelligence
Provides precipitation observations along the Optimal Growth Curve, including 7 day forecast and year selection. - Simulated Field Performance Index
Provides a current year yield estimate based on biomass-yield relationships. - Field Ranking & Alerts
Colorized ranking of fields according to if they are in the optimal band or below the optimal band, coupled with automated reports reports and in‑app alerts.
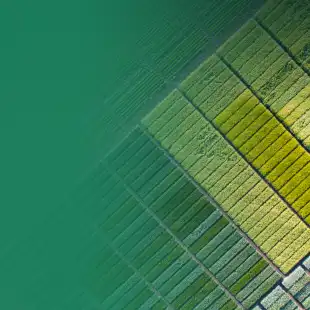
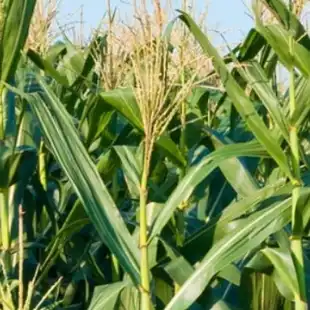
Gallery
Reviews
Sign-in to leave a review for the solution.
0.0/5
0 Reviews
Questions
Sign-in to leave ask a question about the solution.